Whenever I talk about TFS, one of the things I always mention is the fact that because all the data about the software project is now being tracked in a SQL Server database, Microsoft were able to stick a Data Warehouse over the top of all that raw data to give you a really good view on reporting. This is where the real benefits of standardizing on a single ALM solution can really reap rewards and Microsoft in their wisdom give us these reporting features in all versions of TFS including the 5-user limited TFS Workgroup edition that is included with most peoples MSDN subscription.
The only problem with the reporting side is that many people think that this means they have to go learn SQL Server Reporting Services to write reports. While you might want to figure out Reporting Services to provide custom reports automatically to your team and customers, I personally get the most value out of using my trusty old bedfellow, the tool that got me my first paid “programming” gig and is probably the most abused software package on the planet – Excel.
Excel is a great tool for doing ad-hoc data analysis and digging into some numbers to try and figure something out. It also makes a great prototyping tool to help you figure out exactly what the regular report is that you want to see and then you can go figure out in SQL Reporting Services. Another great feature about Excel is that many managers are very happy to fiddle around in Excel so rather than having them bother you with questions about how the project is going you can simply point them at Excel and it will keep them quiet for days as they slice and dice the data :-)
Let’s get started with doing TFS Data Analysis in Excel by trying to dig into which projects are active in our TFS instance – let’s see which Team Projects are having files checked in over time.
Connecting Excel 2007 to the TFS Data Warehouse
The first thing that we need to do is set up a connection to the TFS Data Warehouse from Excel. Go to Data, From Other Sources, From Analysis Services.
Then enter the details for your TFS Warehouse. This is usually the server running SQL for your TFS instance (i.e. your TFS Data Tier). I am connecting to a TFS Server instance that has the database and the TFS application tier installed on the same machine. My SQL Administrator has given me permissions to access the TFS Data Warehouse so I log in using my Windows credentials.
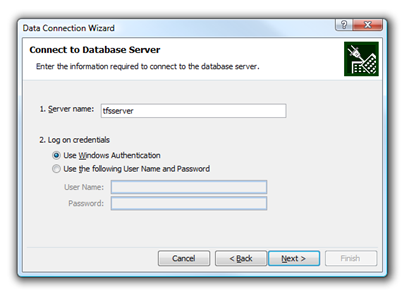
We then want to connect to the TFS Warehouse, so just press next.
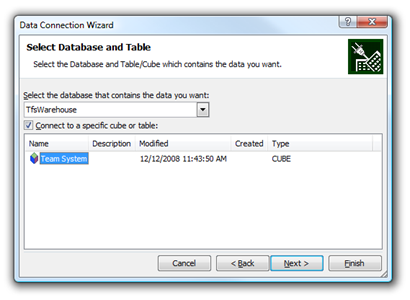
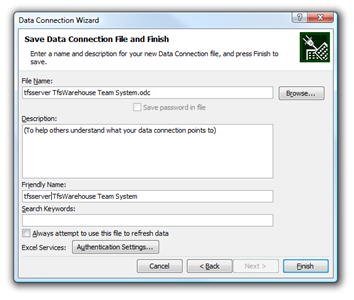
And then we save out this connection so that we can use it again, or share with others by pressing Finish.
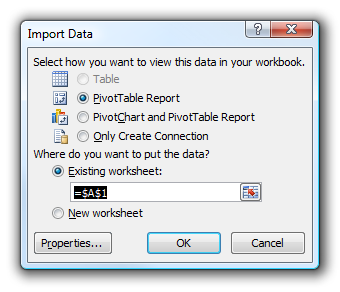
Next we get to choose how we want to import the data. In this example, I’m going to choose a simple pivot table, but you might want a pivot chart if you really want to please your managers by giving them pretty pictures to look at :-)
Play with all that Lovely Data
Now we get an empty pivot table, and we get to see all the things that we can report on. This is where the magic begins and if you have never seen this before you will not believe how easy it is to get data out.
In the PivotTable Field List on the right hand side you get presented with a list of the facts that you would like to report on. Commonly we need the date going across the top of our report, so lets scroll down in the field list until we find the Date section and we’ll drag the Date.Year Week Date down to the column labels.
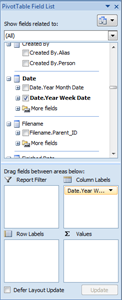
The other dimension that we typically want to have is by Team Project. So let’s scroll down to the Team Project area and drag the Team Project field onto our Row Labels. Now we have our dimensions configured, you should have a spreadsheet that looks something like this.
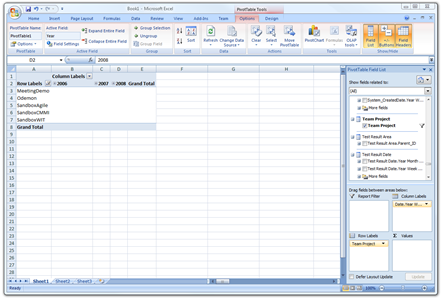
Note that the dates at the top are actually expandable so that you can drill down onto the weeks of the year that you are after. Also – if there is an area that you want to exclude from the report for some reason you can right click on the value, select Filter, Hide. So far so good – but this doesn’t tell us much yet. We want the stuff that we actually want to report on. We said that we wanted to see where code was being checked in, so lets scroll up to the Code Churn fields and drag the Code Churn Count into our Values area. The Code Chrun Count tells us how many files are being checked in for each area.
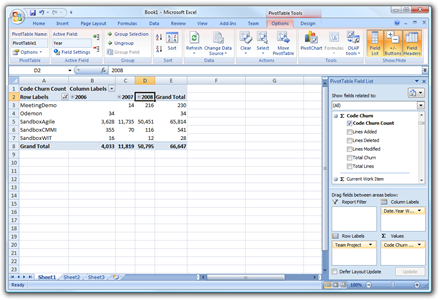
As you can see, we already have the beginning of a useful report. By Team Project is a bit of a broad area though. For version control stuff like this, we may well want to drill down further and look at folder inside of version control. Not a problem at all – simply scroll down and add the Filename.Parent_ID field to the Row Labels and remove the Team Project label now as it is not that necessary. You can now drill down as much as you like – getting a summary of the files changes in each area as you go.
I hope that gives you a quick taste as to the power and ease of use of the TFS Data Warehouse. Once you know how to connect Excel to TFS, the rest is all very easy and quite intuitive. It will take you some time to poke about in the fields available for you to know what they all are and how they can be used. It takes a little while to get your head around the fact that all this data is available and accessible but the power, depth and yet the simplicity of it all is game changing and is one of the reasons why I became a TFS Fan.
TFS 2010 sees some huge improvements in the reporting areas, with very nice looking and easy to customize sample reports, but also more advanced examples of Excel report speadsheets. However, you don’t have to wait for TFS 2010 to come along to start drilling into your data. Go fire up Excel and do it today!


Martin,
This is an excellent write-up on using Excel as a TFS reporting client, thanks! I should say, though, that there's an inherent problem with Excel-based reporting: security. Let me explain:
Once your administrator gives you the permissions to access the warehouse, you get access to data from ALL team projects, and there's no easy way to restrict access to a single project. This might be OK for small shops or even large companies that do not need to pass any security-related certifications.
But imagine a big services firm developing software for a number of customers, or a firm developing software for the healthcare vertical - in such cases, inability to restrict warehouse access to a specific project really becomes an issue. Unfortunately, this issue affects my employer as well, so we had to ditch Excel-based reporting, even though it would have saved us some custom reports development.
This is a fantastic write-up. I can tell that this helps give me a leg up into creating reports!
A.
Do you know how to grant access to a single TFS project? The person needs to use Report Designer to create reports for his TFS project but i dont want him to see data from other TFS projects.